Resolving the quality data fragmentation problem in high-complexity automotive manufacturing
Case study
·
Defect Ontology ∙ PFMEA Alignment ∙ 3MIS Traceability ∙ Rework Analytics ∙ PDI Optimisation ∙ Stack: Neo4j, Go, React
Executive summary
A premium automotive OEM faced a structural quality data problem common across the industry: the same defect was recorded differently in every system that touched it, making cross-domain analysis effectively impossible.
Factory rework data, warranty claims, PDI inspection plans, PFMEA risk assessments, and quality notifications each described the same physical failure in incompatible vocabularies, creating silos that left root cause analysis slow, incomplete, and manual.
The platform described in this case study was built to resolve that problem at its foundation. Not by integrating data feeds, but by building a canonical defect identity layer (a Defect Ontology) that recognises the same defect across all source systems and enables analytics that could not exist before.
Headline outcomes
12 redundant PDI inspection items identified. Capacity recovered.
4 high-RPN inspection gaps previously undetected. Risk surfaced.
1 traversal to trace warranty claims to factory PFMEA. Was multi-day.
22 rework items identified as ineffective. Process signal.
6+ production gateways with rework planning mismatches. Planning gap.
92% VOC Pulse. Voice of customer quality signal at launch.
Manufacturing a premium vehicle involves dozens of production gateways, thousands of part interactions, and a quality management stack accumulated system by system over years. Each system is individually fit for purpose. Collectively, they describe the same physical reality in mutually incomprehensible terms.
Quality teams observed a pattern with no clean analytical explanation: 3MIS warranty claims were tracing back to defect modes the factory had recorded, inspected, and in some cases acted on, yet the connection between these events had never been formally drawn.
Consequences and operational impact
Rework planned in as fixed cost. No mechanism to distinguish avoidable from necessary rework. Gateway budgets set without root-cause visibility.
PDI checklists misaligned with risk. Over-inspection on clean components. Under-inspection where factory escapes were occurring.
3MIS claims not traced to production. Lag of months between warranty event and PFMEA update. Current run unaffected.
PFMEA drifting from reality. High-RPN items with no detection. Low-RPN items heavily controlled. A static artefact, not a living document.

Cross-domain trace: warranty to factory, before the platform
3MIS warranty claim → manual export and VLOOKUP → institutional knowledge → multi-day effort → PFMEA record (maybe).
The approach: a horizontal data fabric built on Defect Ontology
The platform was designed around a single architectural conviction: the right level of abstraction is the defect, not the system. If the identity of that failure can be resolved canonically, every downstream analytic becomes possible.
A Defect Ontology, a semantic identity layer, sits above all source systems and creates a unified vocabulary for defect classes. It resolves records from each system to a canonical identity: the Cluster.
How one physical defect (paint surface contamination) appears across systems.
PFMEA. ProcessStep + FailureMode + Severity / Occurrence / Detection = RPN.
Factory (defect logging / rework). Material + DefectGroup + Symptom + Gateway + ReworkTime.
PDI inspection plans. Part + FaultType + InspectionPlanID + RPN Threshold.
Warranty (MIS / 3MIS). CausalPartName + CausalIssue + WarrantyPeriod + Zone.
QCR (notifications). Symptom + Damage + Department + Status + Severity.
The cluster: canonical cross-system defect identity
Cluster (Front Bumper / Surface Finish).
PFMEA. N failure mode rows.
Defect Logging. N rework records.
Warranty MIS. N warranty claims
PDI Plans. N inspection checkpoints.
QCR. N notifications.
Three-stage cross-system identity resolution pipeline
Stage 1: Fuzzy string matching. Part and material names.
Stage 2: Semantic embedding. Symptom meaning equivalence.
Stage 3: Manual curation. Engineer confirms or rejects.
Platform capabilities
Six integrated modules built on the Cluster identity layer. Each surfaces analytics that no single source system could produce alone.
PFMEA Alignment Dashboard: RPN vs inspection coverage
At programme launch, 4 high-RPN failure modes had zero PDI detection coverage, while 12 low-RPN items were over-inspected.
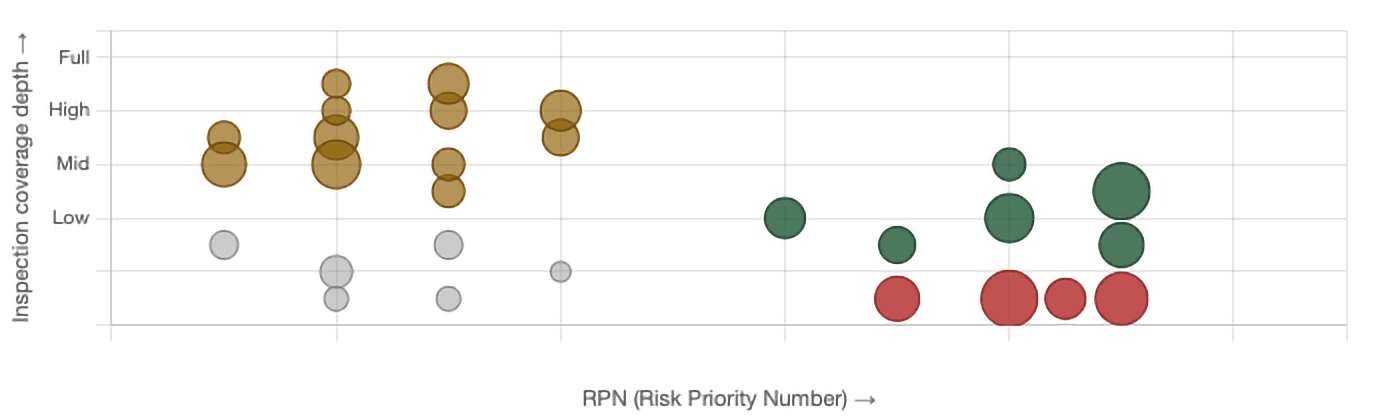
Legend: red = high RPN with no inspection (gap). Green = high RPN with inspection present. Brass = low RPN with redundant inspection. Grey = low RPN with no inspection (acceptable)
PDI / 3MIS Cluster Escape Analysis
For illustrative defect clusters: proportion caught in factory vs escaping to customer. A high escape rate demands a different intervention than a high detection rate.
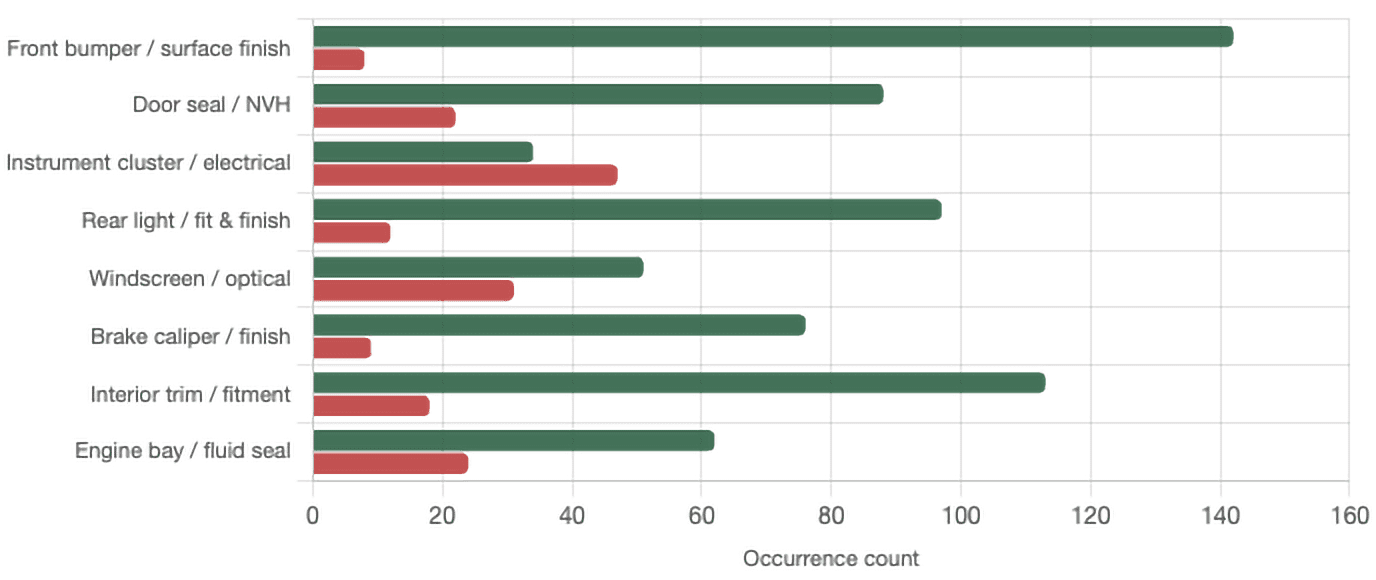
Legend: green = factory detection (defect logging count). Red = customer escape (MIS / 3MIS count).
Executive KPI Dashboard: programme launch summary
22 rework ineffective items.
12 inspection ineffective items.
8 control plan ineffective items.
12 inspection redundant items.
4 inspection missing (high RPN).
92% VOC Pulse at launch.
Finesse / Rework Analytics: planned vs actual across gateways
Mismatches between planned and actual rework time surface process capability issues and planning assumptions not revisited against recent production data.
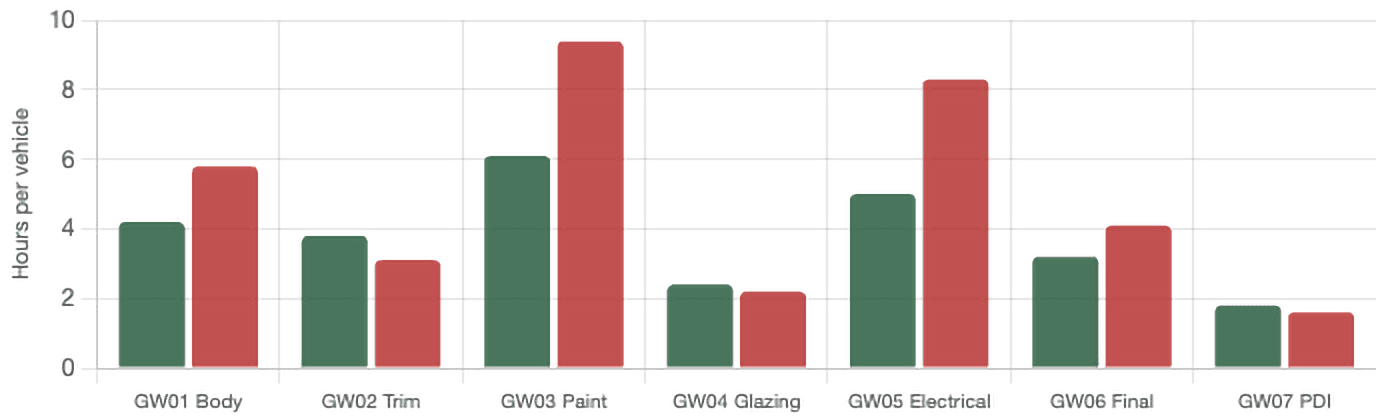
Legend: green = planned rework time. Red = actual rework time. Gateways shown: GW01 Body, GW02 Trim, GW03 Paint, GW04 Glazing, GW05 Electrical, GW06 Final, GW07 PDI.
Technical architecture
A production-grade analytical system designed for scale, auditability, and enterprise identity integration. The architecture deliberately separates ontology computation from the query and visualisation layer.
Backend
Go REST API. Zap structured logging. Kubernetes horizontal scaling.
Relational store
MySQL. 50+ table schema covering entity ingestion, denormalised graph tables, match quality metadata.
Graph database
Neo4j. Millisecond Cluster identity traversal across all source systems.
Matching pipeline
AWS Batch. Fuzzy string matching and semantic embedding similarity at scale.
Frontend
React and TypeScript. Recharts. Nivo Sankey. ReactFlow for Quality Navigator.
Identity and observability
Microsoft Entra SSO. DataDog infrastructure and application monitoring.
Data flow: from source systems to insight
Source systems
PFMEA risk data
Defect logging rework data
Warranty MIS claims data
PDI plans inspection
QCR notifications
AWS Batch Matching Pipeline
Fuzzy matching, semantic embedding, and manual curation
Outcomes and impact
Outcomes drawn from the initial programme deployment. The intent is to characterise the order of magnitude and nature of impact accurately.
Root cause identification time
Warranty cluster investigations dropped from multi-day manual correlation to a single graph traversal in the Quality Navigator. The structural barrier (disconnected vocabularies) was removed by the ontology, not by process change.
PDI capacity recovered
12 redundant inspection items identified. Effort on low-RPN, consistently-clean components released for redeployment to higher-risk areas.
4 high-RPN inspection gaps surfaced
Failure modes with meaningful process risk and no corresponding PDI detection control. Invisible to any single-system view, immediately visible in the PFMEA Alignment Dashboard.
Rework planning accuracy challenged
Planned vs actual mismatches identified at more than 6 gateways at a granularity not previously available. Basis for process improvement or planning recalibration established.
3MIS traceability as standard capability
Any warranty claim can now be traced to its Cluster, factory defect logging history, and PFMEA failure mode in a single interaction.
The compounding effect of the ontology: As more production data flows through the platform, matching confidence improves, Cluster definitions mature, and cross-domain linkages become denser. The analytics available at month twelve are qualitatively richer than those at month one. Not because the platform changed, but because the ontology learned.
Is this problem present in your organisation?
The quality data fragmentation problem is not specific to any particular manufacturer, vehicle architecture, or production volume. It is a structural consequence of how quality management systems have evolved across the industry. If your organisation recognises warranty investigations that require manual data correlation across two or more systems before root cause can be assessed, the problem is likely present.